An acronym meaning "Overall Equipment Effectiveness", it is an indicator measuring productivity and efficiency of production in your company. In other words, it measures how close your company is to perfect production.
OEE is one of the most important indicators in manufacturing industry, given its capacity to showcase every fundamental parameter of your production - availability, performance and quality - in a single percentage.
An OEE score of 100% means your plant only produces good parts, as fast as possible and without unplanned stops. Thanks to this formula, you can pinpoint the source of the most frequent productivity losses bringing that percentage down:
-
Availability: idle times and unplanned stops
-
Performance: production rates and minor interruptions
-
Quality: output of defective parts
How is OEE calculated?
The following figure is a good representation of OEE calculation, we will be detailing each of their components next.
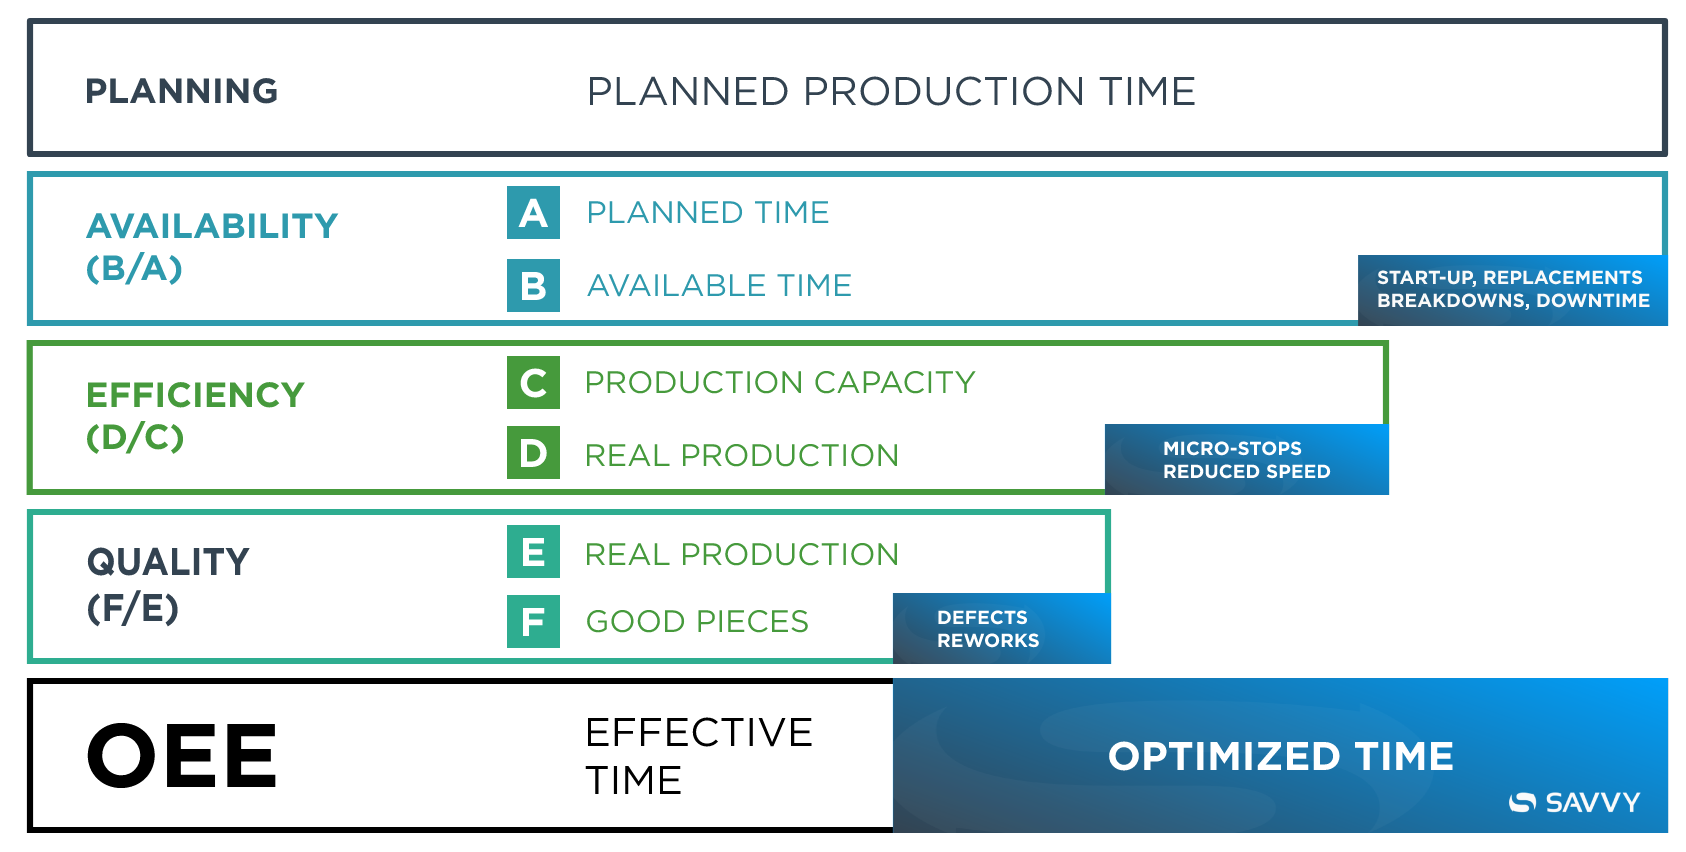
For starters, it is necessary to bear in mind that your plant is not actively producing round the clock, hence the need to define non-productive time. For instance: plant closing times, lunch breaks, maintenance, etc.
Once "planned production time" is calculated, it is time to analyze the three main losses on your output.
Availability comprises calculation of the times your machine is not available for production, which can be due to many reasons: equipment failure, machine component problems, breakdowns, etc.
Availability = Available time / Planned production time
Performance factors in every issue that slows down the manufacturing process below the previously defined maximum production capacity.
Performance = Real production / Productive capacity
Quality deals with the output of parts that do not meet the defined quality standards, to obtain the time invested in producing defetive units.
Quality = Good parts / Real production
The last step to calculate OEE is to multiply these three factors:
OEE = Availability X Performance X Quality
The result is an invaluable percentage of your general plant productivity. As as an example, lets imagine a component manufacturing company with the following data:
Availability:  Performance:
 .webp) Quality:
Quality: .webp)
Their OEE would be around 70.20%, which is below the acceptable values by World Class:
- OEE < 65% Unacceptable. Causes major economic losses. Very low competitiveness.
- 65% < OEE < 75% Regular. Only acceptable if still in improvement process. Economic losses. Low competitiveness.
- 75% < OEE < 85% Acceptable. Improvement must continue to exceed 85% and advance towards World Class. Slight economic losses. Slightly low competitiveness.
- 85% < OEE < 95% Good. Within World Class values. Good competitiveness.
- OEE > 95% Excellence. World Class values. Excellent competitiveness.
I already know my OEE, what now?
Despite OEE calculation being the starting point for your company, it is critical to go one step beyond in order to dive into the factors generating production problems, with the final goal of finding adequate solutions to mitigate them.
At Savvy, we create advanced dashboards about the various elements affecting OEE, so that plant directors, maintenance staff and managers may understand in detail what goes on in their plant.
Keeping in line with the previos component manufacturing company example, lets picture the company having an availability of 60% and wanting to know the reason for this decrease. In order to find the root of the problem, the customer could leverage Savvy's tools in the following fashion:
-
They can select the date range to analyze, and choose the days / shifts with the lowest availability.
-
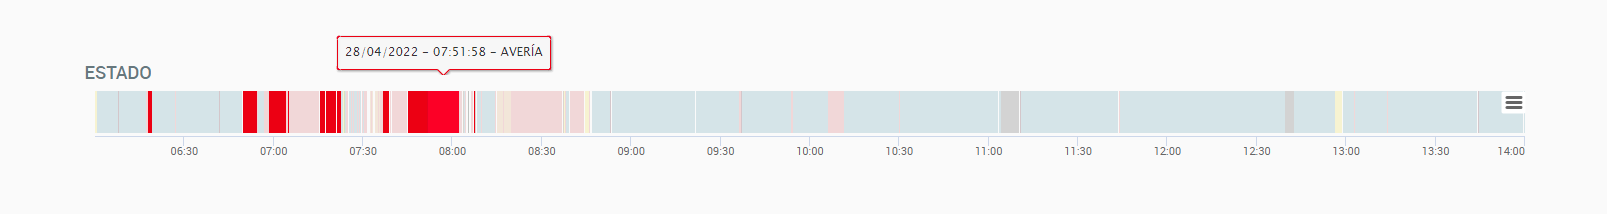
The status bar displays the occurrence and classification of stops and their duration.
-
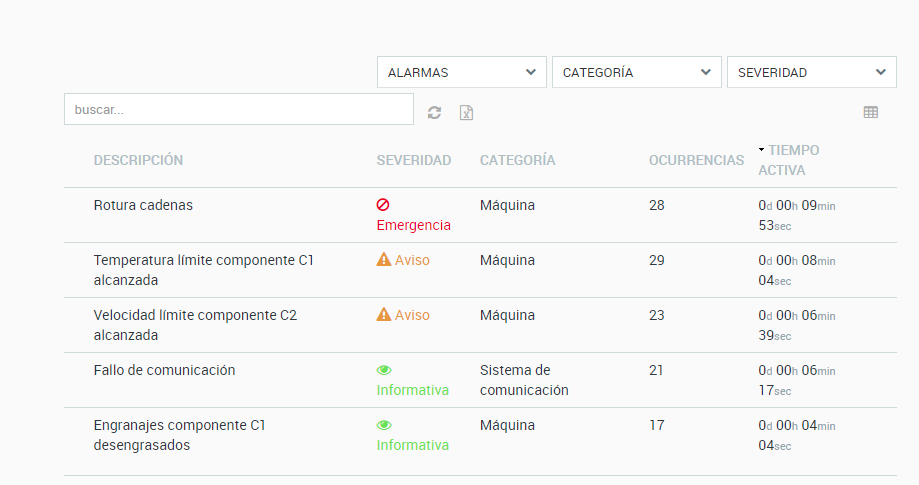
To know the reasons for each stop, they can access the time chart showing the states the machine has gone through and any alarms raised.
-
They can learn the main reasons for machine stops in detail, the time between failures and compare different periods.
Like this, they will not only know the availability of their plant, but will be able to drill down into every cause to take effective measures instantly.
Unlike other digital solutions, we integrate production data with internal machine and process data, which enables us to trace which specific parameters are responsible for bringing productivity down (low OEE).
Would you like to know more? Find about or solution for Manufacturing Intelligence.